One of my favorite benchmarking tools is HammerDB. In a nutshell, it allows you to run a well evolved SQL benchmark (TPC-C) against your system to gauge performance. The scenario to picture is an order/warehouse simulator and your metric is how many new orders per minute (NOPM) the system can crank out.
CPU, memory, disk all matter for SQL and so all make a difference in the achieved NOPM. Other factors include how many virtual users (you configure) are running against the TPC-C and if you want to get networking into the mix, then you can run the benchmark from a client against a remote SQL server.
HammerDB also has nice features such as running in Autopilot mode where you can run, for example, 5 minutes with a single user, then 5 minutes with 2 users, then 4, then 8, then 16, then 32 … and so on. This mode is my preferred method as I can just setup a benchmark, start it, and just walk away knowing I can just check the logs later for the results.
Another nice capability is the master/slave mode. Basically, you can coordinate multiple clients to pummel a server simultaneously. I don’t use it often, but I have used it.
Getting started…
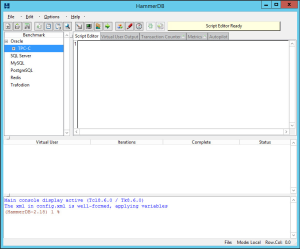
After installing and launching, HammerDB is going to appear like this…
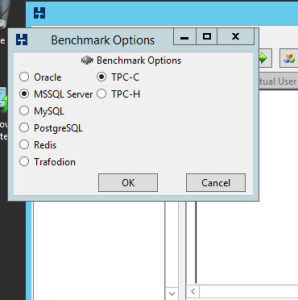
I’m going to be testing on MSSQL Server, so I will close Oracle and select SQL server instead. Then I simply pick TPC-C.
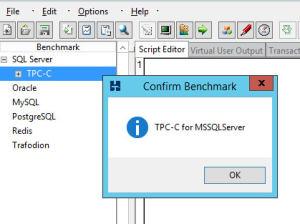
And then confirm.
Now you will need to create your initial empty TPC-C database. Simply go into SSMS and create a new database. I’m calling mine “tpcc”. You can get fancy and tweak the number of database files and logs, and size them to prevent autogrowth, … etc. It does help maximize the benchmark numbers. Remember, you’ll need to be fair and tweak both systems when running a comparison.
 For a first try, just use the model default database.
Now that we have a “tpcc” database on SQL, time to let HammerDB prepare it for testing. We do this by going to the Schema Build -> Options where we’ll put in the SQL connection string info.
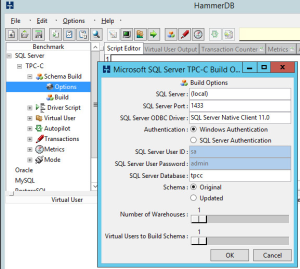 For your first time, just use the original schema. Once you start tweaking for higher numbers, building a schema with multiple warehouses will help your cause. My rule of thumb has been to simply to make the number of warehouses equal to the number of processor cores … 4 processor cores, 4 warehouses. 16 cores, 16 warehouse… etc. I don’t know if that is ideal, just what I’ve been doing.
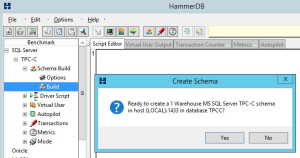
Once the schema build options are ready, double-click Build …
Then click Yes
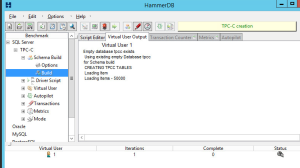
It may take a while, just let it build until you see the TPCC SCHEMA COMPLETE.
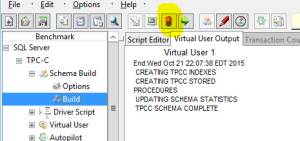 Congrats, you have a database ready to test against. Click the red traffic light icon (highlighted) to stop the build.
Now let’s configure a test run…
First, we need to again configure the connection string. This time for the benchmark. Open Driver Script -> Options. Your connection string from the schema build should populate here automatically otherwise you can fix it.
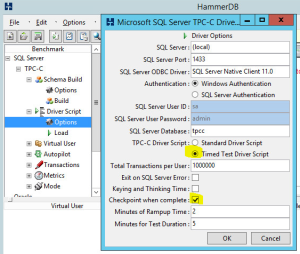 I prefer using a timed test and highlighted the options in the screenshot. The reason is that I typically do use the Autopilot test so I can test a number of virtual users for 5 minutes at a time. Then I can ultimately plot a chart of NOPM against the number of virtual users to get more of a profile. Some systems scale up virtual users better than others, and you just need more data to see it. Use Autopilot to perform the data runs for you.
Double-click Load to load those driver options.
Now, lets go to Autopilot -> Options.
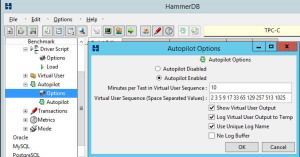 Enable Autopilot, then configure the length of the test and the number of virtual users.
Runtime: Since our driver options specified a 2 minute ramp up, a 5 minute test run, and Autopilot is specifying a 10 minute interval (10-2-5=3), there is going to be a 3 minute cool down where virtual users are disconnected. If the virtual users cannot all disconnect within that cool down period, HammerDB will wait before starting up the next run.
Users: For each run, there will be one control user and the rest will be virtual users against the database. So, basically if you want 4 virtual users, you configure the number 5 in Autopilot. My screen shot shows 2 3 5 9 17 33 65 129 257 513 1025 … but actually corresponds to a number of working virtual users of 1 2 4 8 16 32 64 128 265 512 1024.
I always check off the option to log the output and to use unique log names. Occasionally HammerDB crashes and the scrolling log in the GUI will not be retrievable when that happens. Use the text log files instead. For this run, on my system, I already know that 1024 users is too ambitious and will crash the system (here is where I might use master/slave to have multiple instances run together to create the 1024 users).
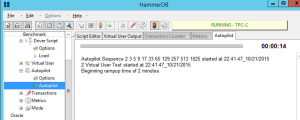
Double-click Autopilot and let it run. Stop it anytime using the red traffic light.
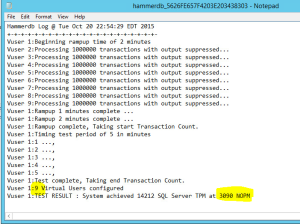
A log file output will look something like this …
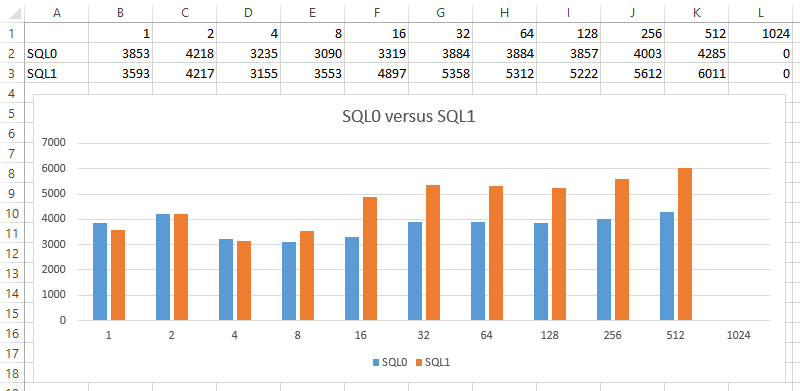
Using Excel we can simply generate comparisons like this …
I’ve used HammerDB to assist with such comparisons as VMware versus Hyper-V versus bare metal … static memory versus memory overcommit versus dynamic memory … local RAID versus SAN … SQL failover cluster versus availability group … and in this blog I plan to be using HammerDB as a tool to benchmark server core. I’m curious to see the results!

Leave a Reply